Cautionary Indicators Continue to Abound
I have been quite quiet of late, largely because there has been little activity of note in my opinion.
In general, I see U.S. markets near the end of their multi-year rally (I am currently positioned pretty heavily short, though I wouldn’t be altogether surprised if this slow creep higher continues into 2015), and I see signs of similar exhaustion in the European indexes. I see emerging markets as demonstrating relative strength, with precious metals serving as a wild card with significant potential upside. However, I would be mildly surprised to see precious metals move higher alongside an equity breakdown.
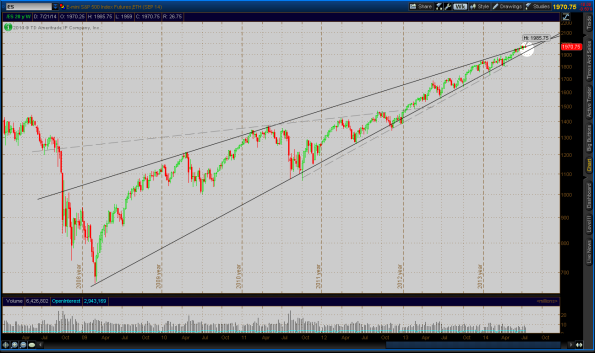
So let’s look at some charts. First the U.S. big boys. The S&P (SPY), though this is actually the e-mini Futures chart, remains in the final stages of a rising wedge that has been over five years in the making.
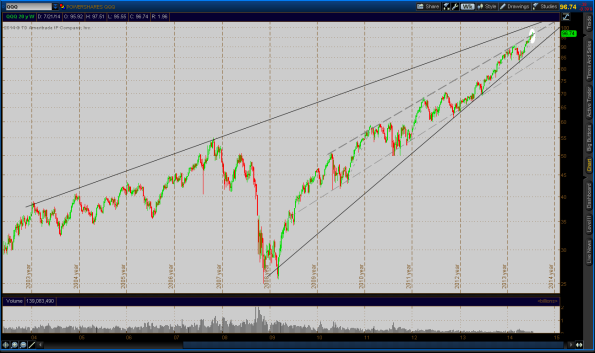
Nasdaq (QQQ) is near resistance of a multi-year rising channel. it could rally a bit before hitting the resistance of a decade+ rising wedge.
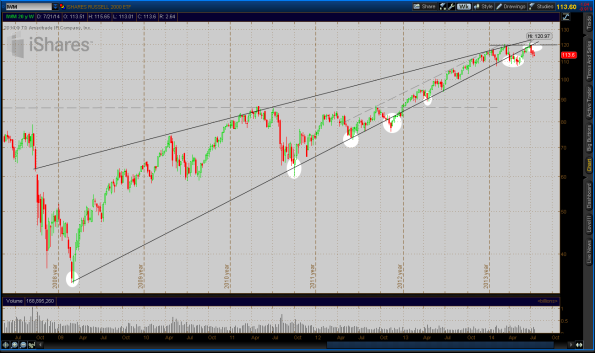
Junk bonds (JNK) have flashed weakness of late. They are frequently an early harbinger of equity breakdowns. Even more telling than the action in junk bonds is the pronounced weakness from small caps (IWM). Ace technical analyst Chris Kimble recently noted that small caps have broken support relative to the S&P for the first time in over a decade. Small caps broke support of a multi-year rising wedge earlier this year. They have since rallied back to the underside resistance where they were recently rejected, forming a double-top to boot. Shorting small caps (via the inverse ETF, RWM) is my largest position at the moment so I feel pretty strongly about this particular play at the moment.
That summarizes my caution regarding the U.S. markets, though I see very similar patterns in Europe.
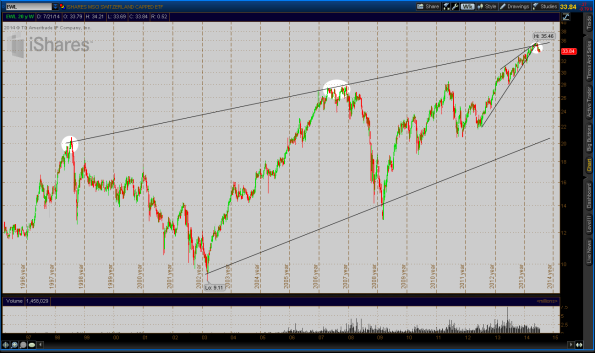
Switzerland hit a resistance trendline over 15 years in the making, and looks to be breaking down from a recent multi-year rising wedge.
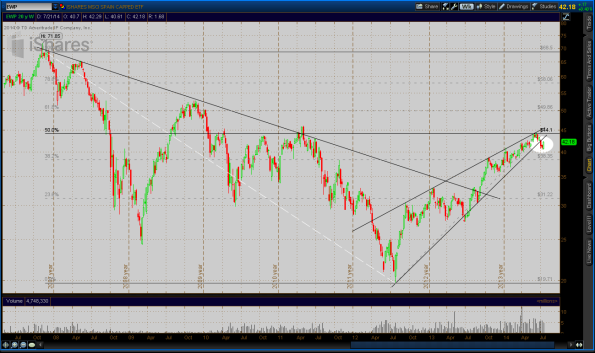
But the national ETF that I am most interested in shorting is Spain. It broke down from a rising wedge at a 50% retracement of the 2007-high to 2012-low. It rallied last week and is approaching an underside test of the trendline it broke. I will be looking to short there.
On to bullish charts!
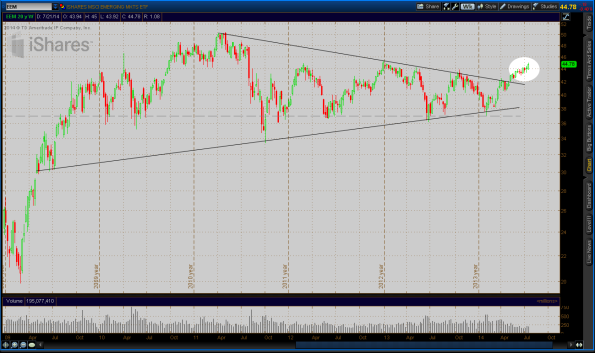
Since the spring I have been keying on emerging markets. EEM continues upward since breaking above resistance a few months ago.
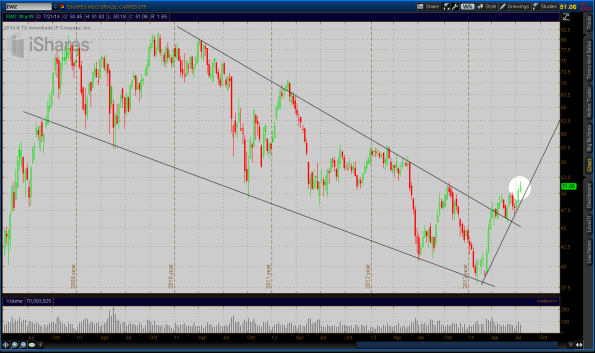
The same positive behavior is also visible in the Brazil ETF, EWZ.
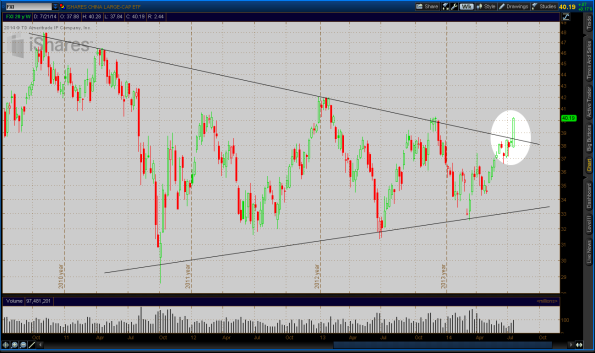
Perhaps most surprising to me is the bullish action from China (FXI) last week. A very strong break above resistance would seem to bode well for China, and perhaps copper (JJC) and the global economy as well.
We are moving into a time of the year that has historically been quite volatile. Time will tell if that trend shows itself this year.
Whatever the case, I will try to hold my beliefs loosely.
